The Charting window allows you to zoom to a selected set of data. This is useful if you have charted a lot of data and want a closer view of a part of it.
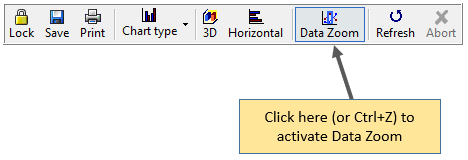
To activate Data Zoom, click on the Data Zoom button in the toolbar.

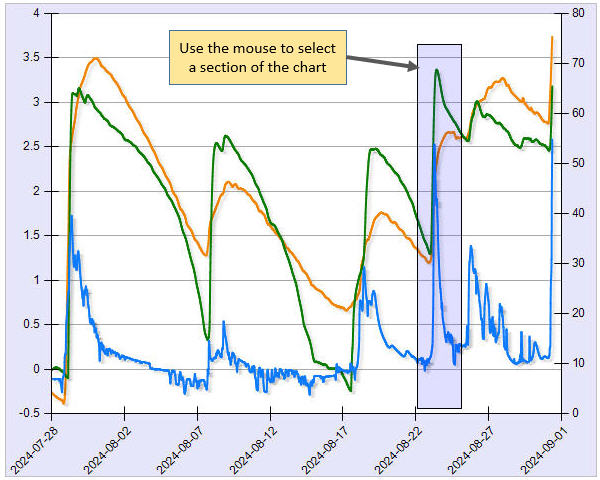
Next, drag the mouse over an area of the chart to select an area of the chart you are wishing to see in more detail.

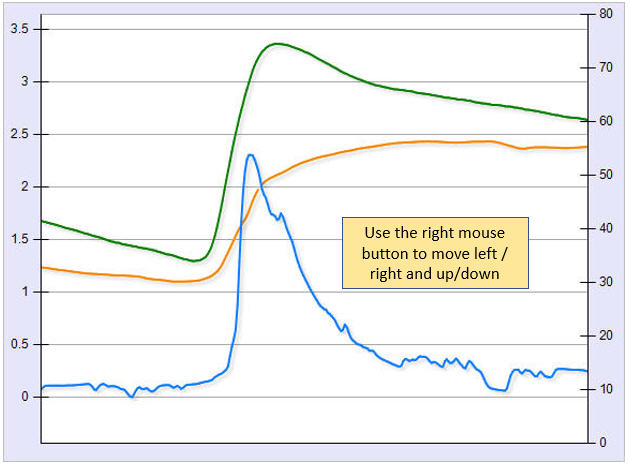
The chart will show the selected section of the chart.

Once you have zoomed to smaller section of your chart, you can hold down the right mouse button and move the chart left/right and up/down. This allows you to move through your chart.
If you are charting multiple series, moving up / down will only move the series which is displayed on the primary vertical axis. The other series and the right axis will not be moved.
To return to the full display, click once in the chart.